Custom Dashboards is where Lookout Analytics users can experiment with creating their own dashboards. This guide covers asking a question using the graphical query builder, adjusting visualisations and creating dashboards.
If you have prior experience in constructing reports through a Business Intelligence tool, then Custom Dashboards would be the suitable choice for you. Lookout can offer guidance on data models to facilitate the process.
Lookout Analytics is powered by Metabase, a business intelligence and analytics tool.
The following article will reference Metabase guides and provide links to resources on how to get started. Not all functionality outlined in the Metabase guides is available through Lookout Analytics, including:
-
SQL editor
-
Alerts
-
Sharing questions with public links
-
Dashboard subscriptions
-
Embedding
Accessing Analytics Custom Dashboards
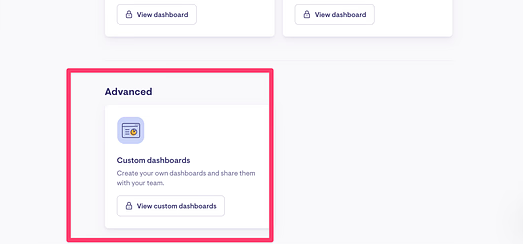
To access Analytics Custom Dashboards, click the 'Analytics' button in the navigation menu. The Analytics page will display a selection of available dashboards to explore. Select 'Custom Dashboards'.
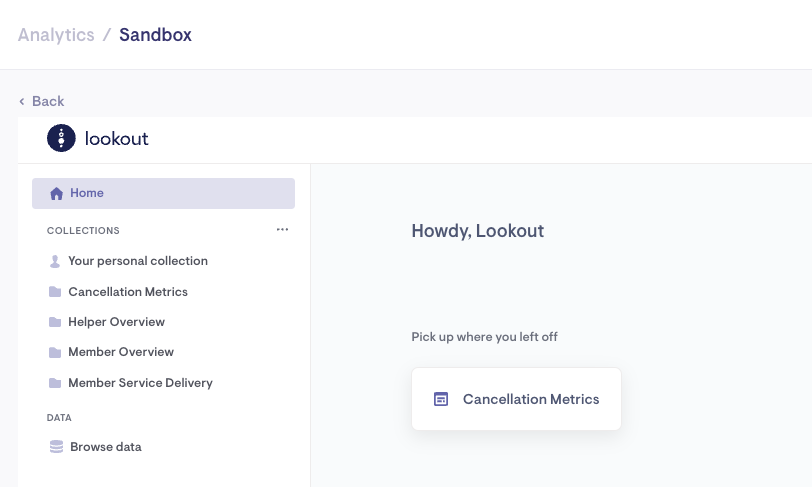
The home view within Custom Dashboards shows your recent dashboard and questions.
Questions
Asking questions
Questions are queries plus their visualization. You can ask questions using the graphical query builder. To ask a question, click 'Your personal collection' and '+ Create a new'.
You can start a question from:
-
A model. A model is a special kind of saved question meant to be used as a good starting point for questions.
-
Raw data. You’ll need to specify the database and the table in that database as the starting point for your question.
-
A saved question. You can use the results of any question as the starting point for a new question.
The query builder
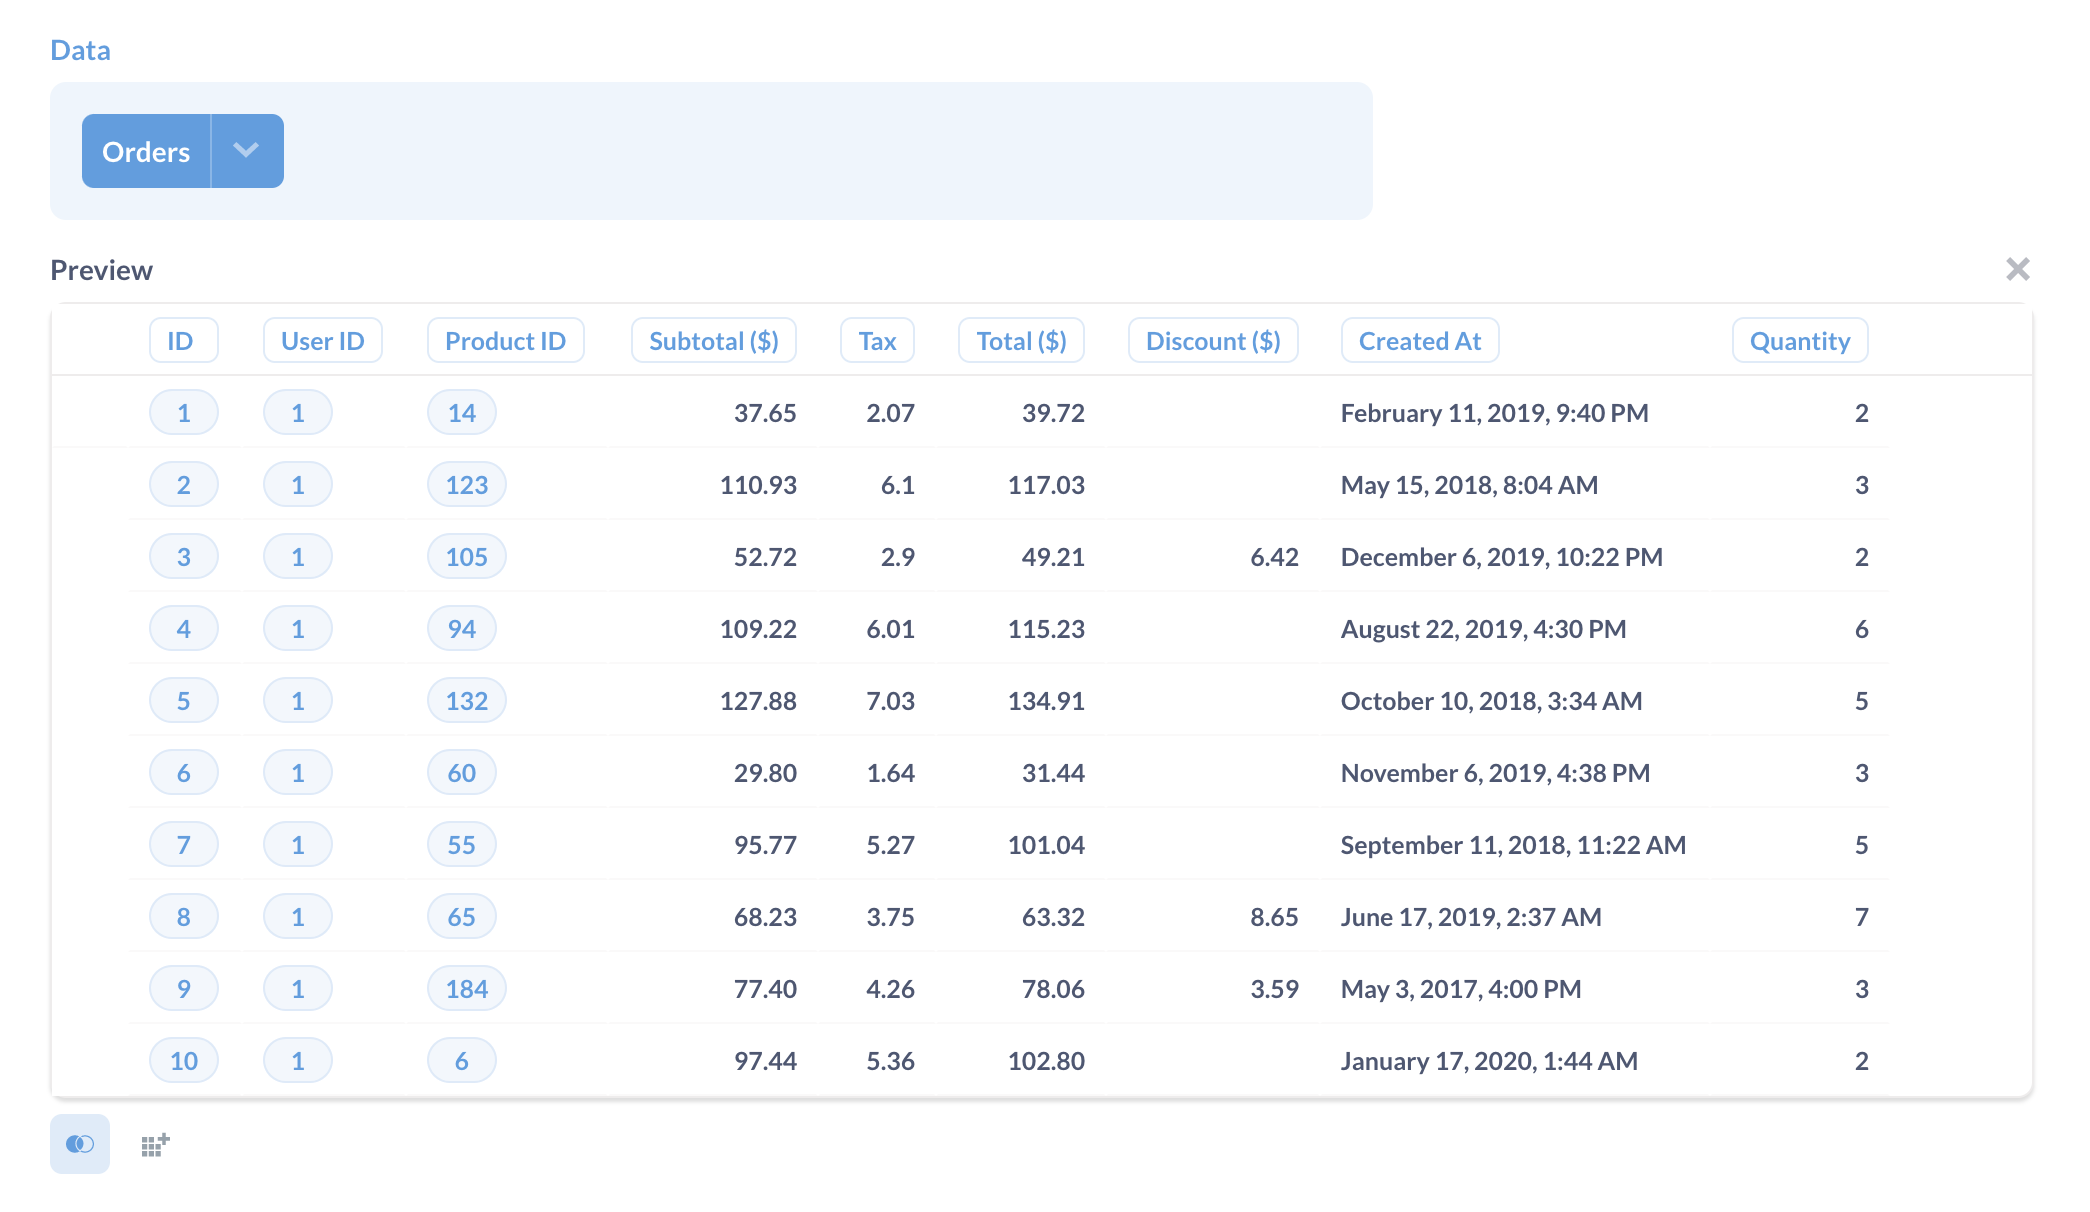
Once you select your data, you will be taken to the query builder. Say you selected Raw data > Sample database > Orders, then you’ll see something like this:
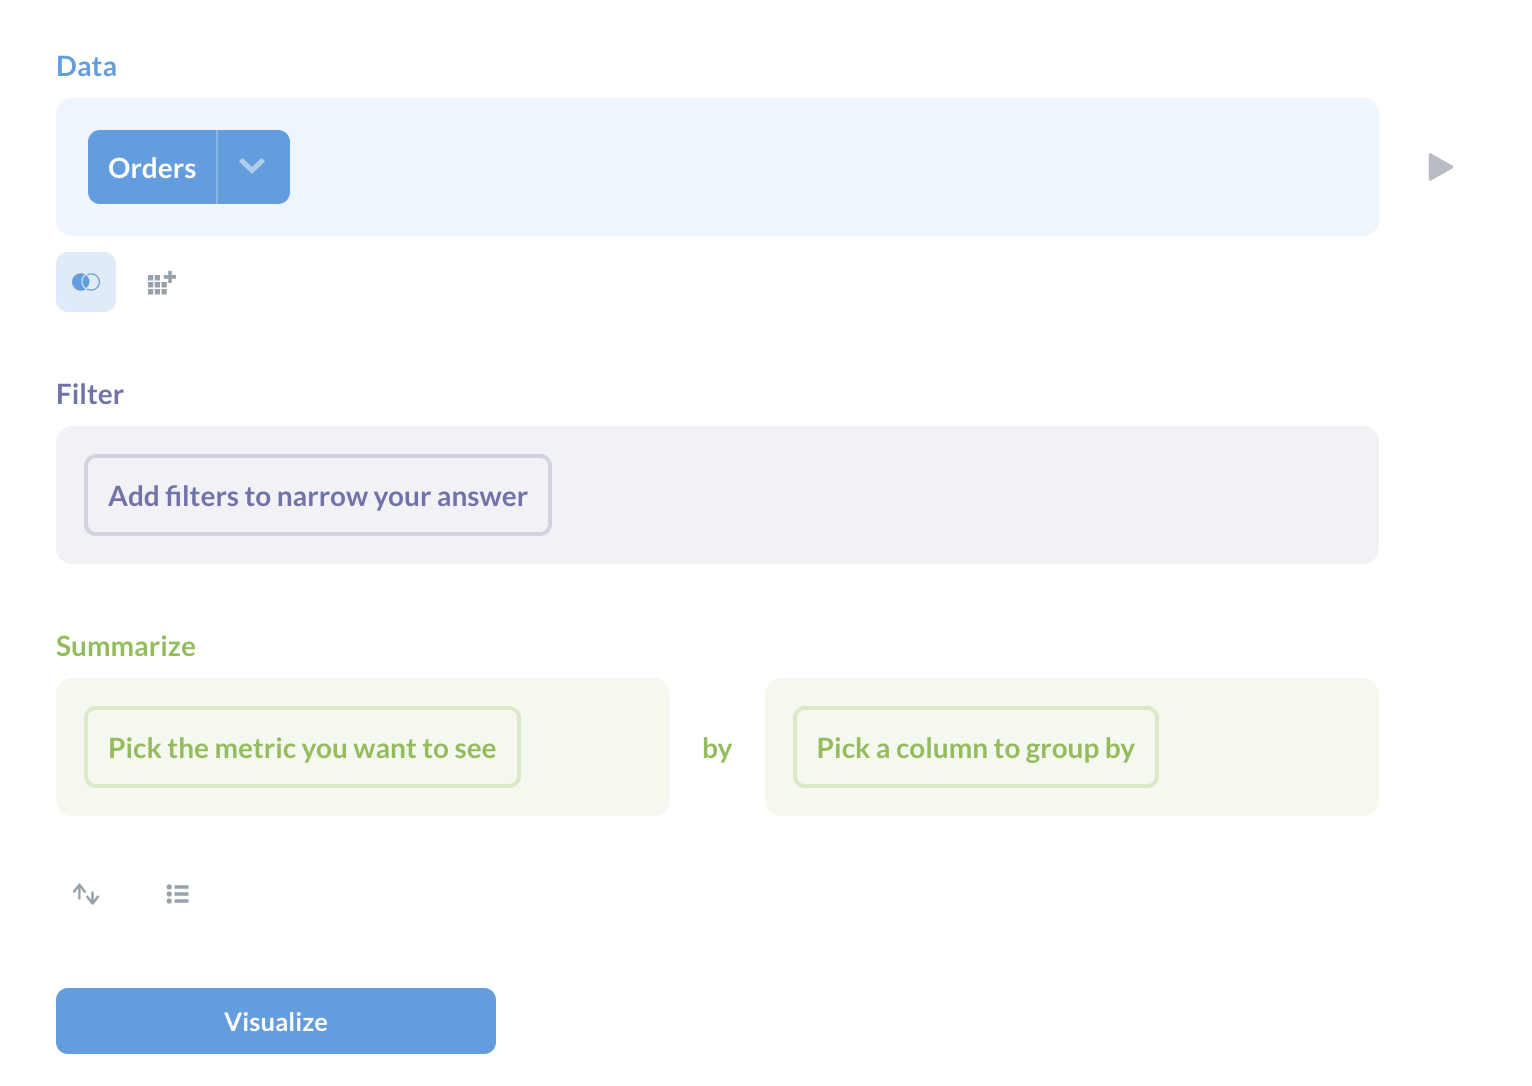
This is the query builder’s notebook editor. It has three default steps.
-
Picking data
-
Filtering
-
Summarizing and grouping by
To the right of the completed step is a Preview button (looks like a Play button - a triangle pointing to the right) that shows you the first 10 rows of the results of your question up to that step.
Learn more about asking questions
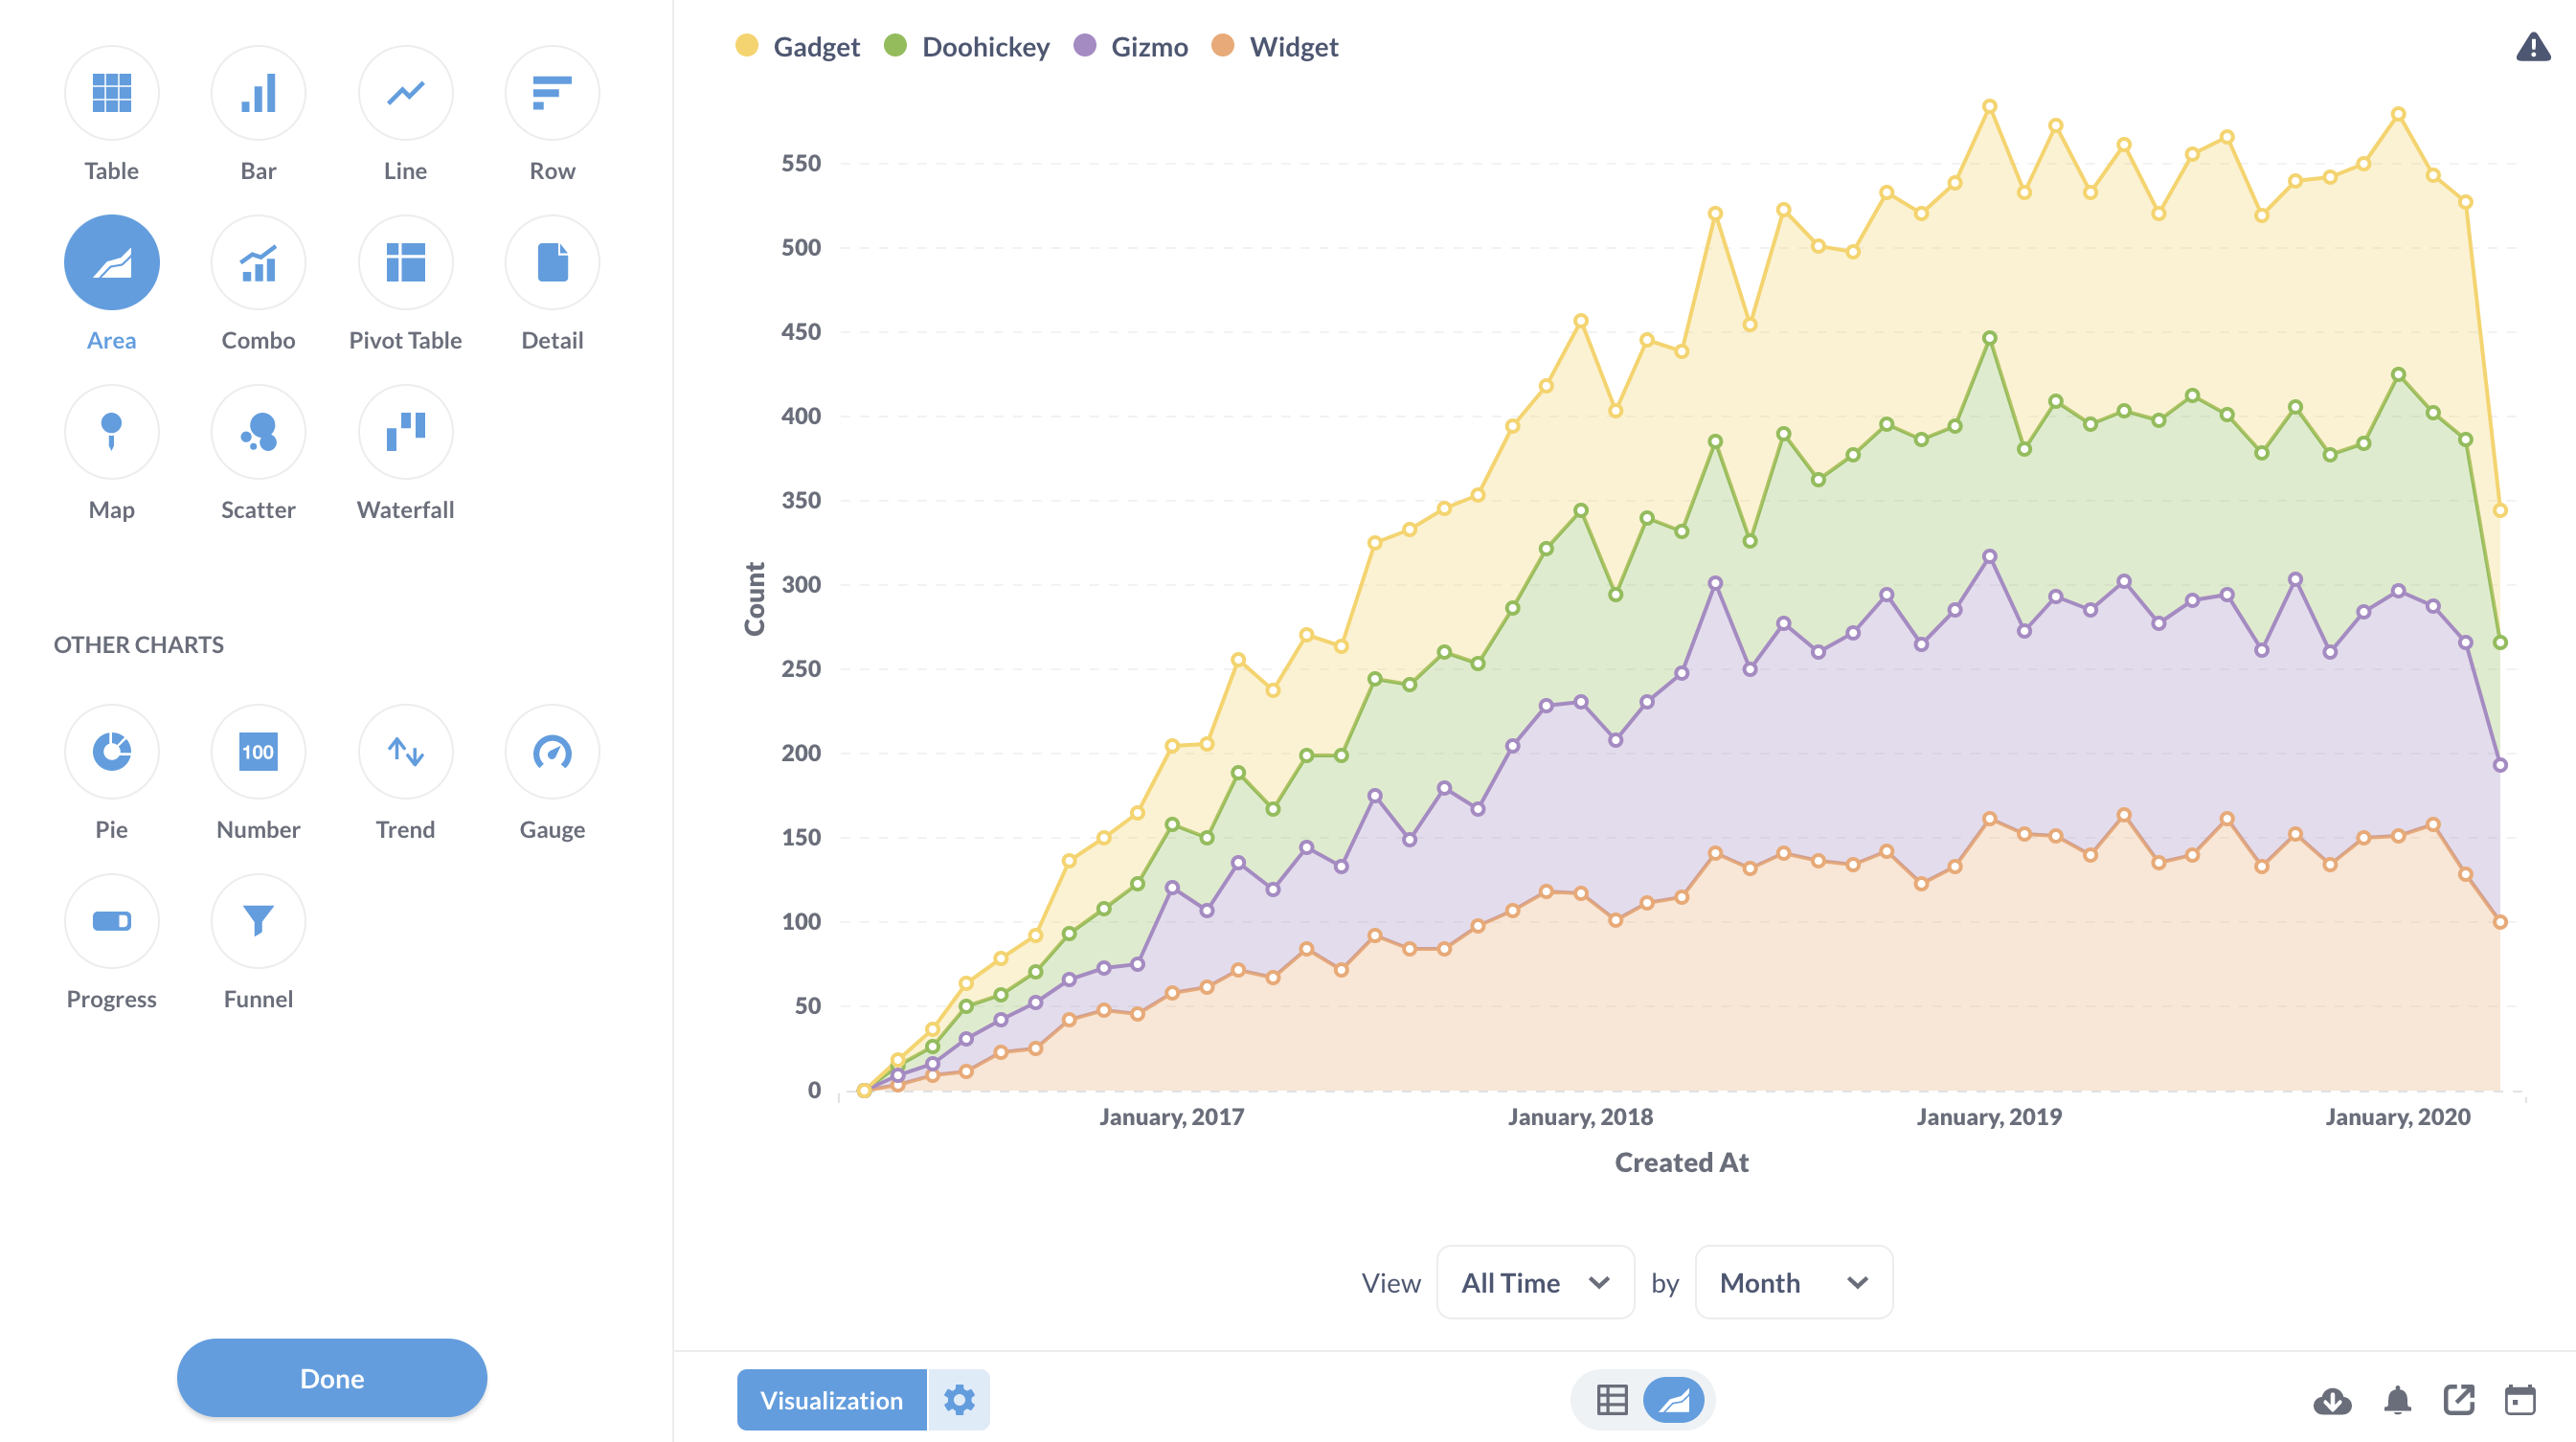
Visualizing your data
While tables are useful for looking up information or finding specific numbers, it’s usually easier to see trends and make sense of data using charts.
Learn more about visualising your data
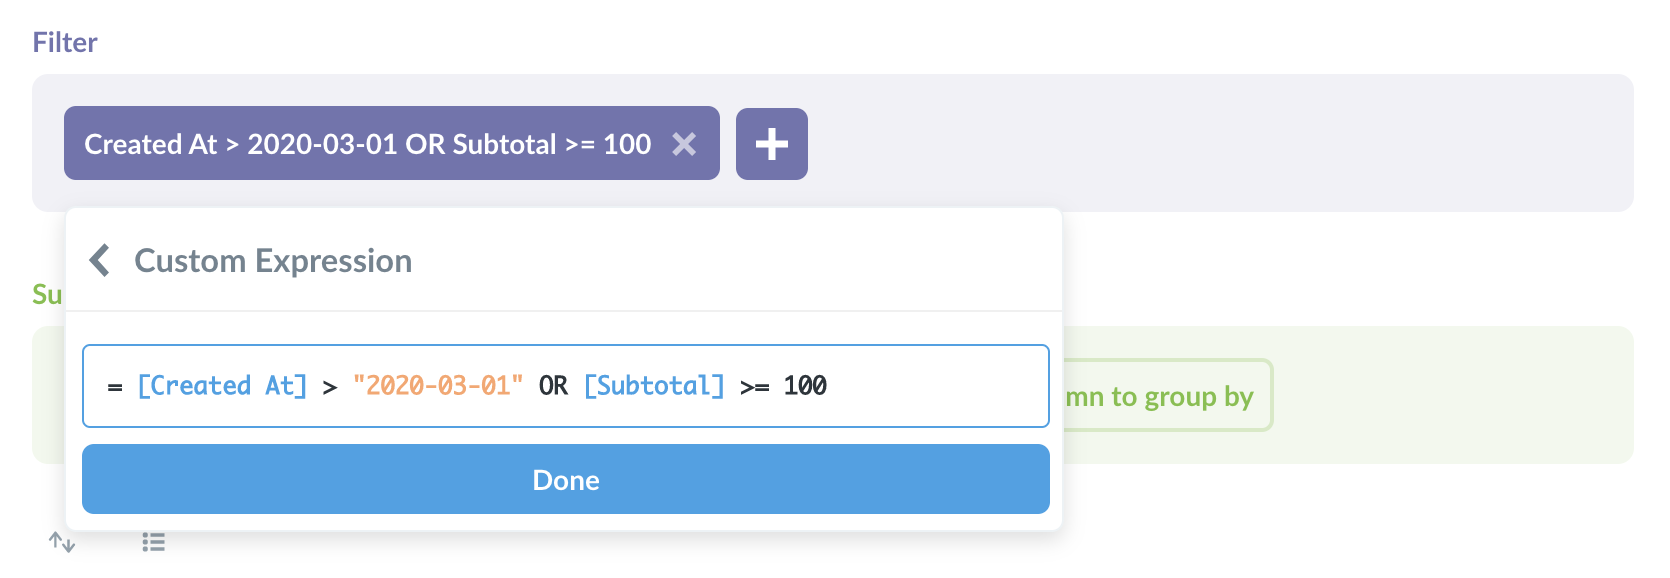
Custom expressions
Custom expressions are like formulas in spreadsheet software like Excel, Google Sheets, and LibreOffice Calc. They are the power tools in the notebook editor of the query builder that allow you to ask more complicated questions.
Learn more about custom expressions
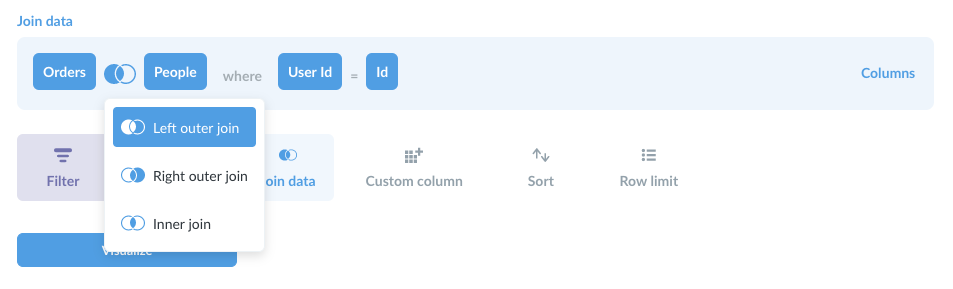
Joining data
You can join data to combine your current data with another table, or even with a saved question.
Sharing answers
Whenever you’ve arrived at an answer that you want, you can save it for later, download your results or export it as an image.

Learn more about sharing answers
Dashboards
Dashboards group questions and present them on a single page. Build collections of questions and arrange tables, charts, and text cards on a dashboard.
To make a great dashboard, you must first decide what you want the dashboard to tell about your data. What questions will give you insight into what you want to know? It helps to think of a topic or theme for your dashboard — something like “workforce utilisation,”.
Adding saved questions to a dashboard
There are two ways to add questions to a dashboard: from the dashboard or the question you want to add.
-
From a question: you can add a newly saved question to a dashboard directly from the window that pops up after you save the question for the first time.
- From a dashboard: Click on the pencil icon to edit the dashboard. Then click the + icon in the top right of the dashboard editing interface.
Auto refresh
If your data updates frequently, you can set up your dashboard to refresh automatically by clicking on the clock icon.