Explore your data effortlessly with Lookout Analytics' collection of intelligent dashboards. Each dashboard is designed to quickly answer your queries and present them in the most appropriate format for your team, whether a bar chart or a detailed table.
💬 Please contact your Lookout representative for more information about the Lookout Analytics add-on.
Dashboards
The dashboards provided by Lookout Analytics assist staff in making informed decisions that align with their role. These dashboards are tailored to specific areas, such as clients, workers, finance, revenue, and operations.
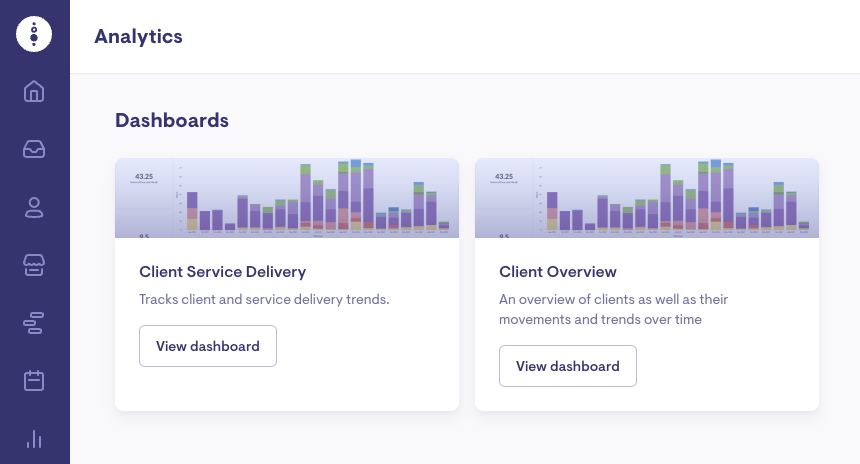
Member Overview
An overview of Members as well as their movements and trends over time.
Member Service Delivery
Tracks Member and service delivery trends.
Care Worker Overview
An overview of Care Workers, their trends over time and turnover analysis.
Cancellation Metrics
A look at the types of visit cancellations, at what period they were cancelled, and who they were cancelled by.
Incident Management Overview
A detailed look into raised incidents, their current status and the trends in their categories.
The Incident Management Overview dashboard requires the Incident Management System (IMS) add-on to be enabled.
Helper Verification Renewals
An overview of helper verification renewals, their status rates over time, and those currently pending.
The Helper Verification Renewals dashboard requires the Verification Renewals add-on to be enabled.
Observation Overview
An overview of observations, including trends and uninvestigated observations.
Custom Dashboards
Experiment with creating your own dashboards.
If you have prior experience in constructing reports through a Business Intelligence tool, then Custom Dashboards would be the suitable choice for you. Lookout can offer guidance on data models to facilitate the process.
Using Lookout Analytics
User permissions
Access to the Lookout Analytics dashboard is determined by Access Roles assigned within Lookout. Each role may be assigned one or multiple dashboards, depending on the specific requirements of the role.
Editing Access Roles requires Staff management permissions.
To include a Dashboard in an Access Role, go to the Settings section and select 'Access Roles'.
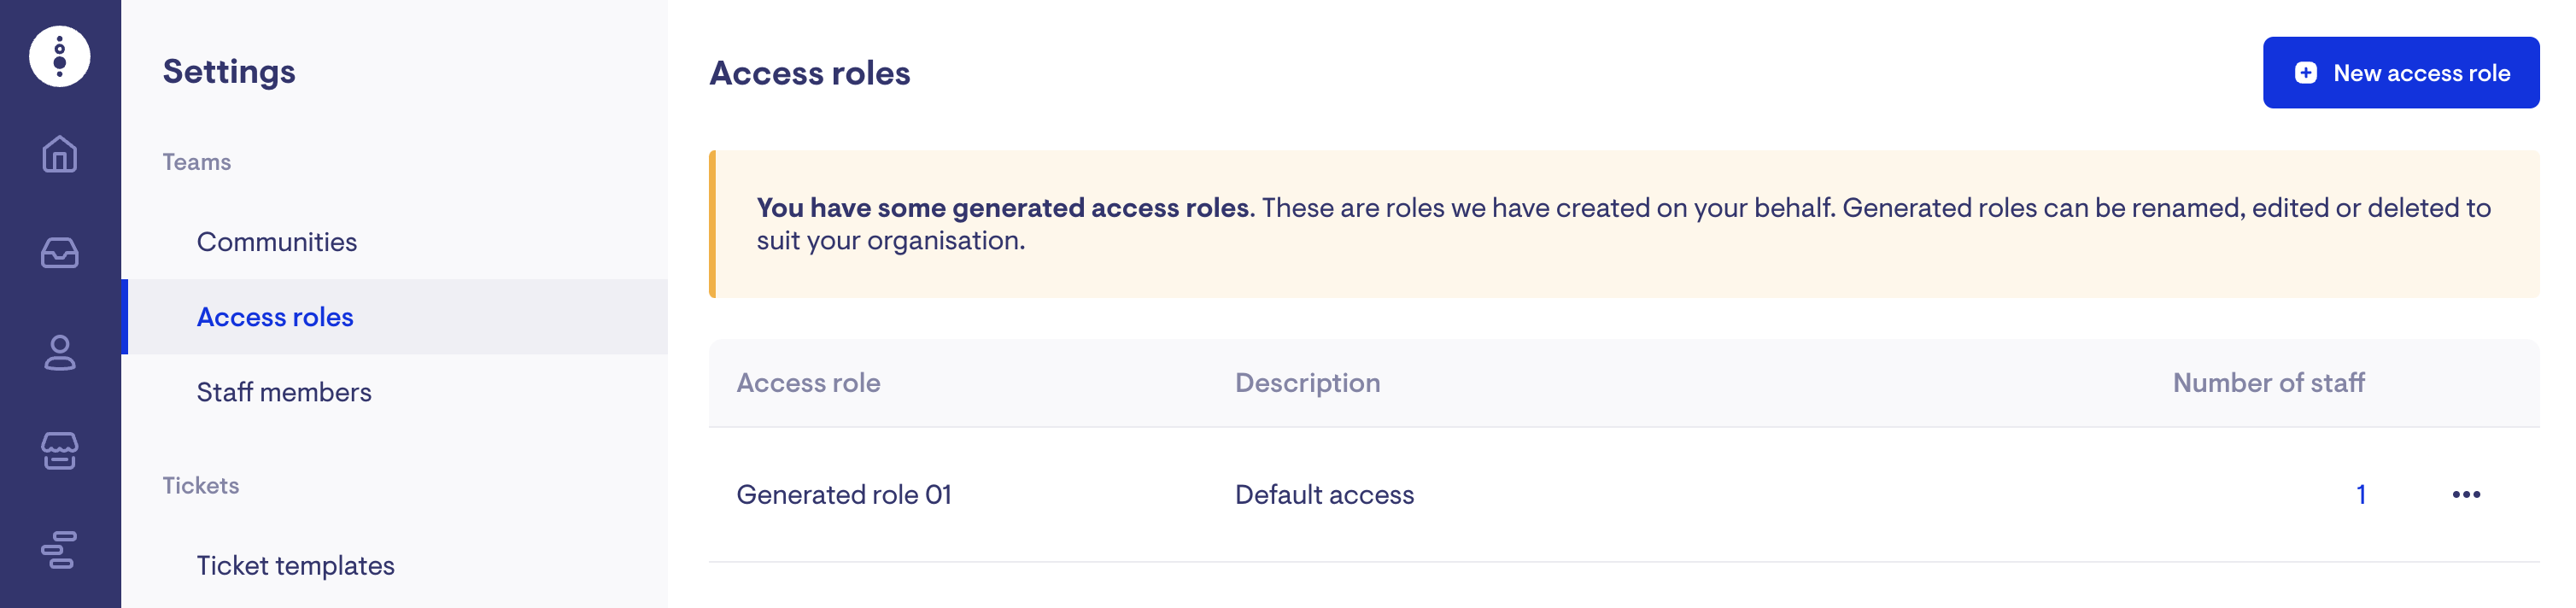
Select the access role for dashboard access that you wish to provide.
To add dashboards to a staff member's role, go to the edit access role page and find the 'Dashboards' section. Click on 'Add dashboard' and choose the dashboards you want to make available to staff members assigned to that role.
Each staff member assigned to the Access Role will be a seat within your Lookout Analytics subscription.
Accessing Dashboards
To access Lookout Analytics, navigate to the 'Reporting' tab in Lookout and click on the 'Analytics' button.
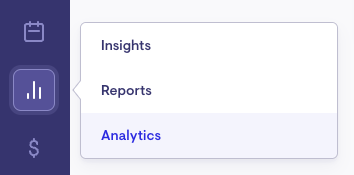
The Analytics page will display a selection of available dashboards to explore.
Exploring Dashboards
Each dashboard will show a collection of cards displaying data in different forms - tables, charts and metrics.
The key way to explore dashboards are;
Date Filter
With the Date Filter, you can customise the data displayed on each dashboard to show a specific time frame.
To modify the date range, click on the dropdown menu for the Date Filter located at the dashboard's top section.
Drill-through functionality
The Drill-through functionality allows you to explore the data behind a visualization or report.
Zoom in on the data
You can click and drag to select an area of a chart to zoom in on.
You can left-click to bring up the Action Menu > Zoom in, and Lookout will create a close-up of the data surrounding your selected value.
View the records that compose that data
To view the individual records that make up a value on a chart, click on the value and select "View these [Record type]" This will bring up a table with all the relevant information.
Downloading data
To download data from each view, click the three dots at the chart's right-hand corner. This will reveal different data download options such as CSV, XLSX, and JSON or PNG.
FAQs
How do I increase the number of staff who can access dashboards?
Your subscription to Lookout Analytics will come with a set number of seats, which refers to the number of individuals within your organisation utilising the Lookout Analytics add-on.
💬 Please contact your Lookout representative if additional seats are required.
How can I share a dashboard with someone outside of Lookout?
Unfortunately, it is not possible to share dashboards externally. However, you can download and share the data from each view through your preferred method.